Labelling in the GUI#
Creating labels#
To create a new behavioural label:
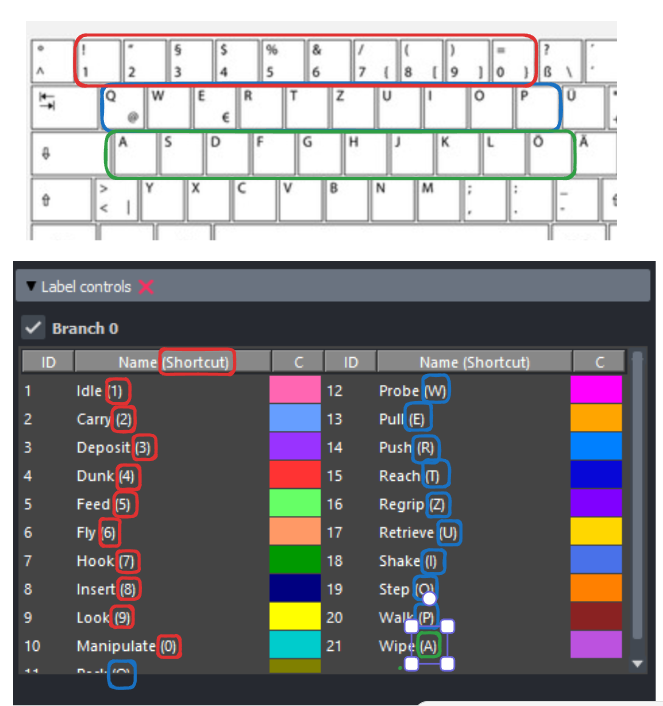
Press one of the number/letters keys (see image below) to activate a specific behavioural label.
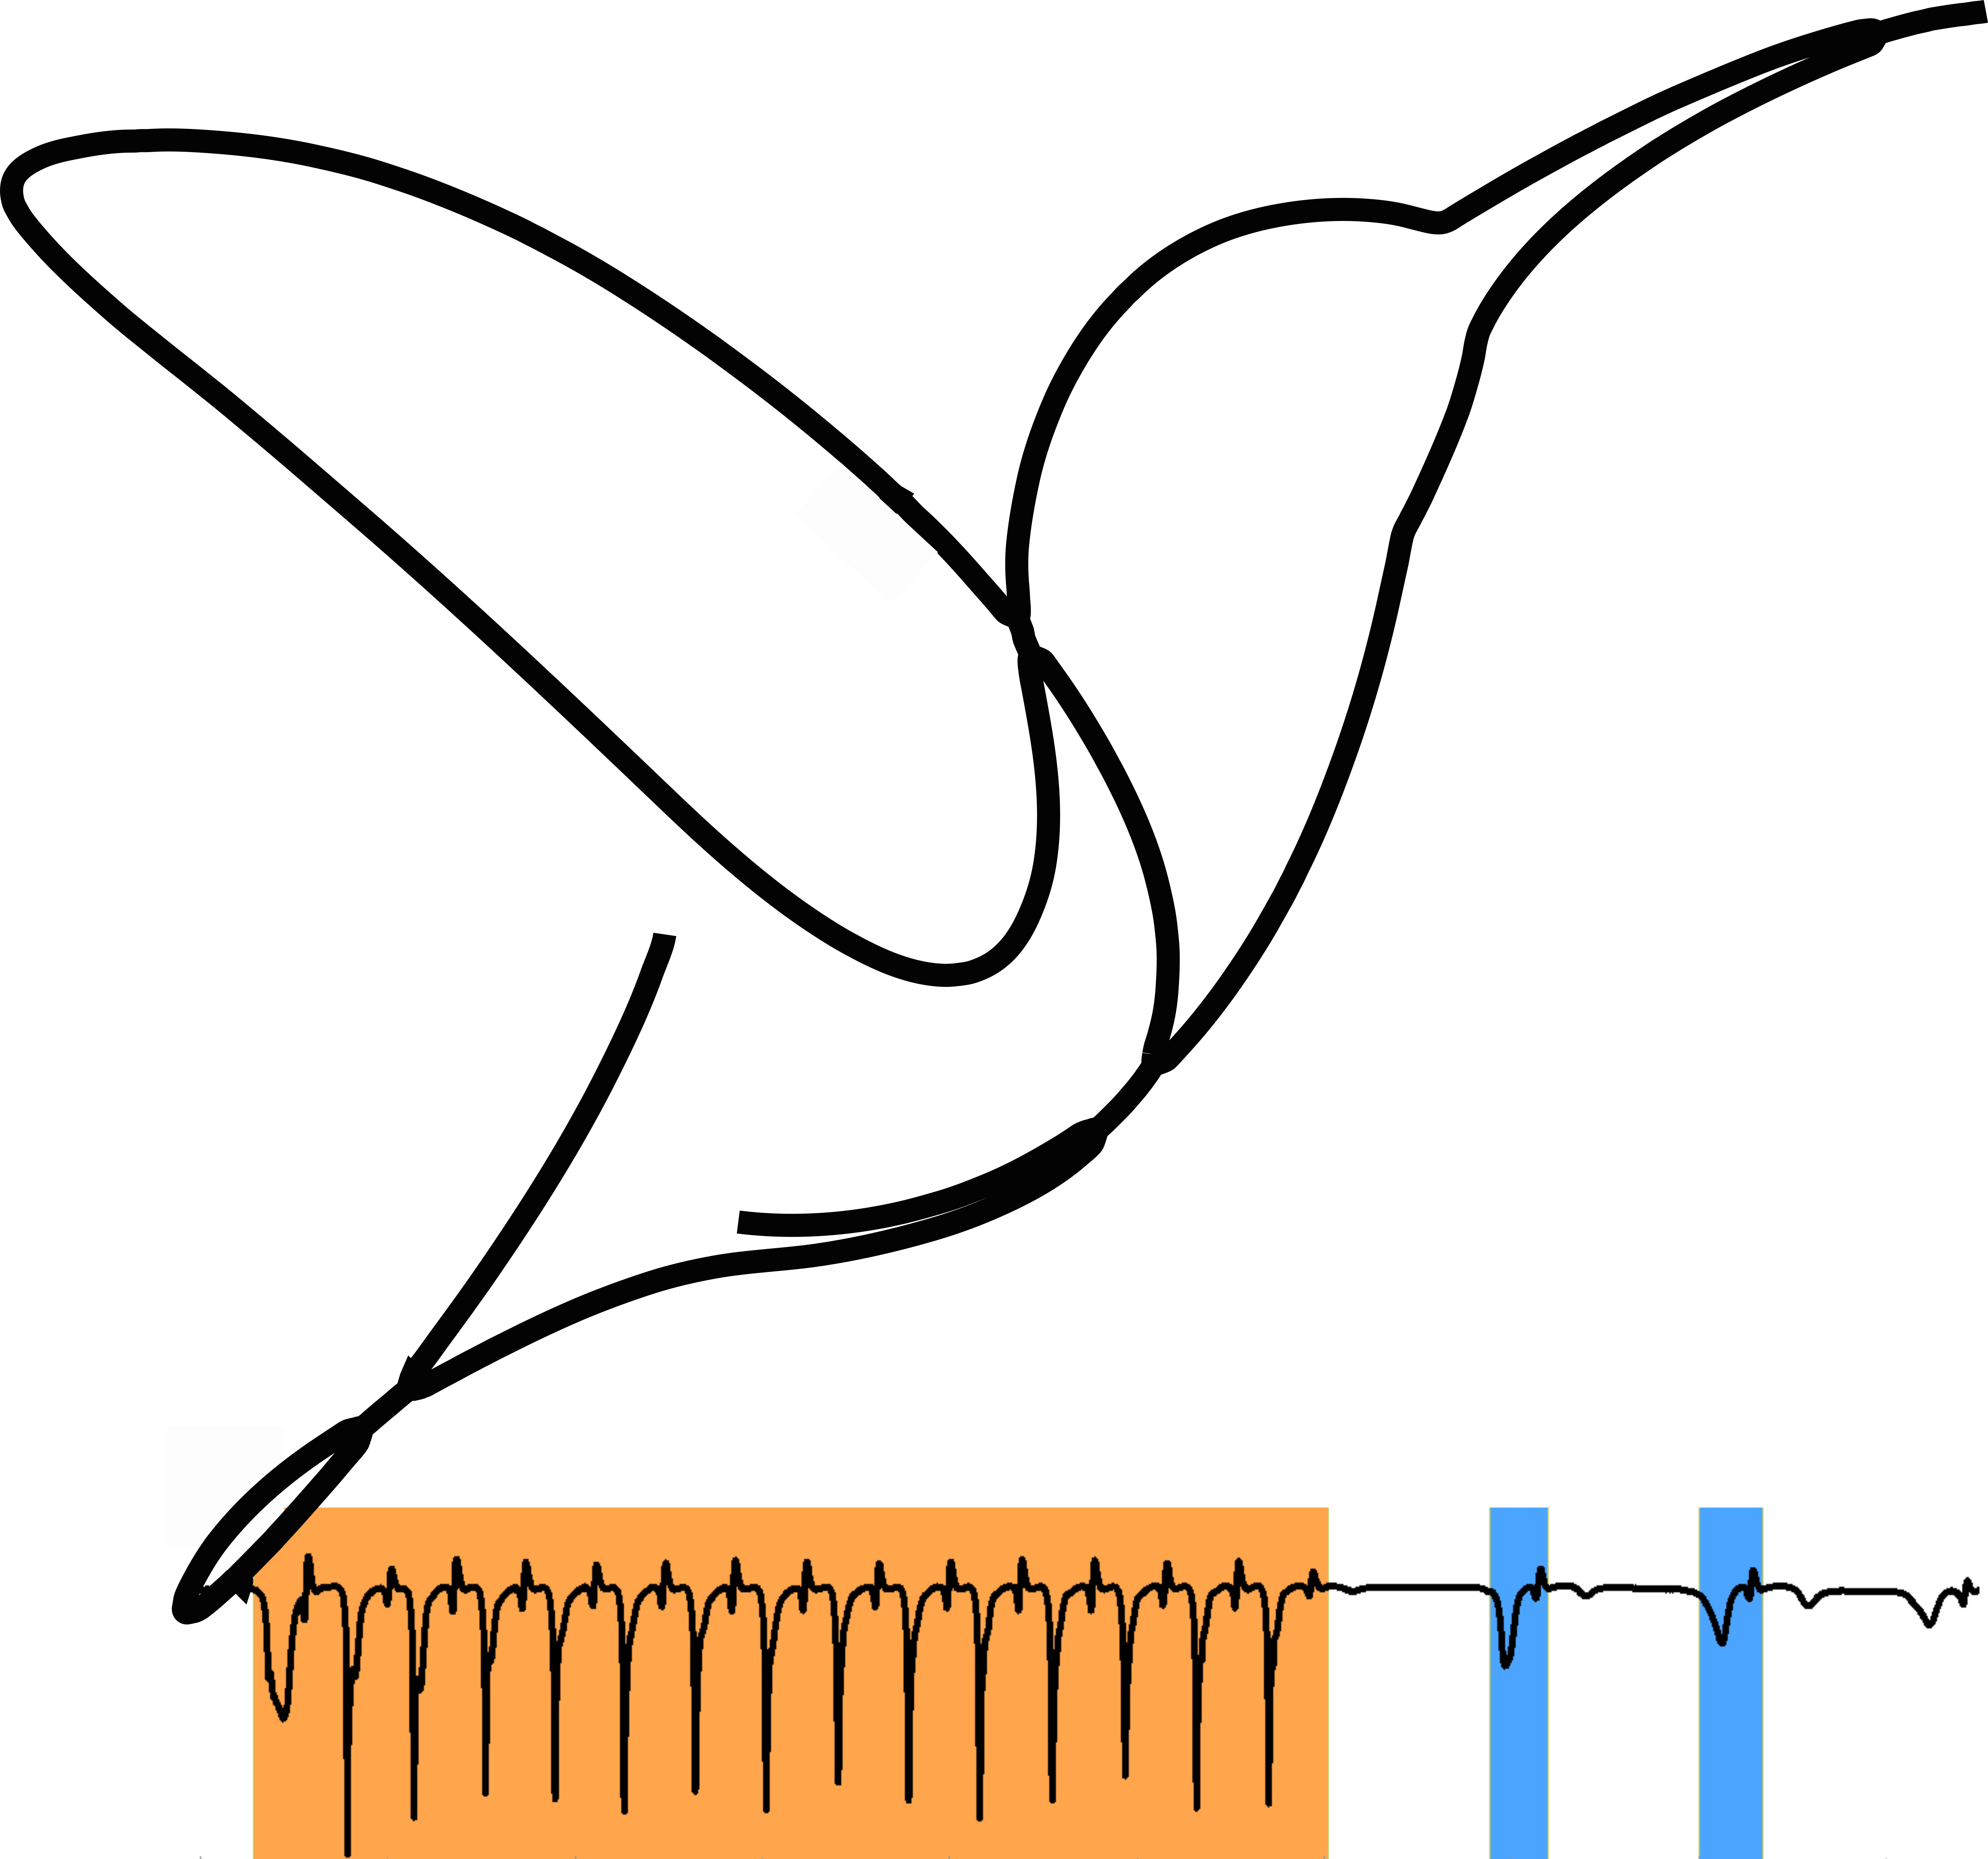
Click twice on the line plot to define the start and end boundaries of the label. For point events, click only once.
The label will be created and displayed with a color-coded overlay.
Playing back labels#
Once you’ve created a label, click on it and press v to play the segment.
You can also use Left / Right to navigate individual frames, or right-click
to jump to specific timepoints. Over time you may find this faster than
playing the video.
Editing and deleting labels#
Use the labels widget interface:
Edit: Select a label (Left-click), press
Ctrl + E, then click twice to define new start/stop boundary.Delete: Select a label (Left-click), press
Ctrl + Dto delete.
Changepoint correction#
See Changepoint correction for how label boundaries are snapped to detected changepoints.